Justin Verlander (2022)
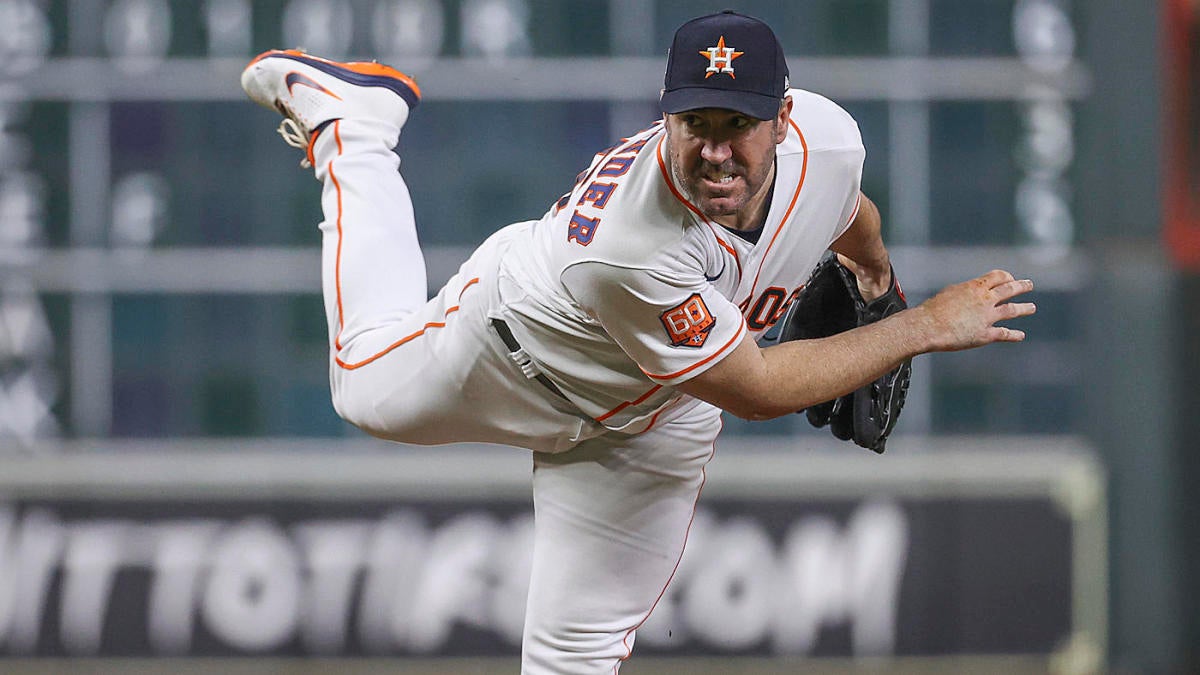
Justin Verlander 🇺🇸 (2022)
Justin Brooks Verlander (Goochland, Virginia, February 20, 1983) is an American pitcher.
Veteran who has played for the Detroit Tigers, and Houston Astros. He has appeared in 9 All-Star games, won 3 American League Cy Young Awards, with the latest one in 2022. He also has 2 World Series titles (2017 and 2022) and one American League MVP award (in 2011).
A legendary player who, at the age of 39, managed to win both the Cy Young and the World Series in 2022. Verlander had a record of 18-4 with an ERA of 1.75(best in 2022 season), in 28 starts.
His ERA was also the lowest for an American League pitcher since Pedro Martinez (1.74) in 2000, he led the American League in wins, ERA, WHIP (0.83), opponent batting average (.186), and hits per nine innings (5.97).
This analysis covers in detail his pitching arsenal and his effectiveness against rivals during the regular season and playoffs. It also compares his numbers with other pitchers, allowing us to assess his performance and determine if Verlander deserves the Cy Young award.
If you have any questions regarding the types of pitches (Fastball, Changeup, etc.), here is all the necessary information
Enjoy it 🙌
1- Defensive power
With 2975 pitches, Verlander was able to strike out 186 players in the regular season and 25 strikeouts in the postseason.
Boasting a pitching arsenal led by the FS Fastball (50.76%), followed by the Slider (28.20%), Curveball (18.86%), and Changeup (2.18%). Throughout the entire season, he only allowed 139 hits, including 22 doubles, 2 triples, and 15 home runs. He had an average of 14.90 pitches per inning.
Being a leader in two of the most important categories, ERA and Wins, Verlander was a key piece in leading the Astros to win the World Series.
Before we begin the analysis, here's a compilation (from YouTube) of his strikeouts with the pitch sequence, to understand why his Fastball and Slider were crucial in 2022:

Among those, the Slider was the most frequently used pitch in that area, with 356 pitches. Additionally, the fact that the vast majority of his pitches were outside the strike zone reflects that he also pitched all around inside and outside the strike zone.
Now, in the chart below, we will see his Strikeouts, Walks, and Hits per Pitch type, considering that the FS Fastball was the most used pitch during 2022 (1510 pitches) and also resulted in the highest number of walks and hits.
On the other hand, his favorite pitch for strikeouts was the Slider with 103 strikeouts. Overall, it's impressive how few walks Verlander had in 2022, with a 4.4% walk rate, ranking him 8th among players with the lowest average.
Also, finishing first in opponent On-Base Percentage (OBP) with an impressive .227, his dominance doesn't stop there, he also led in opponent ISO (Isolated Power) with .084 (second in MLB). ISO is used to measure a batter's raw power, in other words, if opponents could manage to get a hit against Verlander, it wouldn't be easy, especially when facing a team like the Houston Astros.
Verlander threw 934 balls and 831 strikes, of which 54% were called strikes and 46% swinging strikes.

In the chart below, we can see his Strikes. On one side, we have the percentage of strikes thrown in each count, indicating that the counts most likely to result in strikes were the two-strike counts. There was also a low probability of reaching the full count or having more balls than strikes.
It's worth noting that this chart takes into account both called strikes and swinging strikes.
The FS Fastball was the pitch with which he was able to throw the most strikes (43.20%), despite not being as effective as the Slider or Changeup when compared. Additionally, something we can observe in the heatmap chart is that the vast majority of his pitches were thrown towards the right and the lower part of the lower-right corner of the catcher's area (the chart is oriented from the catcher's perspective).
How effective his Slider was in striking out his rivals?, we will see soon!

In the two-strike counts, the Slider was his main pitch, which explains why he had 103 strikeouts with that pitch.


Furthermore, we can see his hit attempts (hits, fouls, etc.) and strikes (called strikes, swinging strikes, and strikeouts), where we can observe that the dominance of strikes is not as high as it appeared in the previous charts. In total, the hit attempts (or balls put into play) account for 59.14%, while the strikes make up 40.86%.
However, this chart does not demonstrate his dominance over his rivals because he faced more attempts to hit compared to Sandy Alcantara in 2022. Even in his two-strike counts, he had more balls put into play than strikes.

Now, we will see a compilation(from youtube) of Justin Verlander's pitching arsenal to have a visual reference, mainly focusing on his Fastball and Slider.
In the second video, we can see his pitching sequence, to get an idea of how he faced his rivals, in this case against the Yankees in the ALCS 2022.
After having watched the videos, it's important to see how Justin Verlander's experience plays a significant role, with excellent command of his pitches and exceptional control when facing opposing players on base.
To further complement his pitches, we can observe in the chart below (from Baseball Savant) that only his Slider(87.4 mph) is above the average pitch velocity (gray lines). Verlander's other pitches remain within the 2022 MLB average.
In the graph on the right, it displays the vertical and horizontal movement of each pitch, with the MLB averages for each pitch type indicated next to those "circles". In the case of Verlander's Slider, we can see that, compared to the MLB average it doesn't have as much vertical movement, but it maintains the same level of horizontal movement, which, in my opinion, makes it a challenging pitch to distinguish from a Fastball.

Now, we will take a look at his primary pitch for striking out opponents, the Slider.
There are three very important factors that define Verlander's Slider:
Variation: Verlander is known for varying the break and velocity of his Slider. This variability keeps hitters off balance and prevents them from predicting the pitch's movement consistently.
Versatility: While the Slider is often a strikeout pitch for Verlander, he can also use it to induce ground balls or weak fly balls. Its movement allows him to generate different types of contact, which is essential for keeping hitters guessing.
Location: Verlander's ability to locate his Slider effectively makes it even more dangerous. He can throw it for strikes on the corners of the strike zone, inducing weak contact or swings and misses when batters misjudge its location.
For more information about Verlander's season, let's examine a heatmap graph that displays the opponents' batting average and the whiff % (an unsuccessful swing resulting in a miss) rate against his Slider.
What this graph illustrates is as follows: the green line represents the strike zone, and all the squares in red, white, and blue denote where Verlander has thrown his Slider.
The higher the Whiff average (indicated by the red color), the more it means that batters swung and missed in those areas. This demonstrates how lethal the Slider was; a significant portion in the lower-right corner of the catcher's area is where most of these events occurred.

The opponents' batting average chart against the Slider, below. Here the situation is reversed: the blue color indicates areas where the average is very low or in many cases zero.
It's interesting to note that the same zone where batters swung and missed the most (as shown in the graph above) is similarly reflected in this graph. Also, it's remarkable that over 28 games, very few batters had the opportunity to put the ball in play and have it result in a hit.
For reference, a batter who maintains an AVG of .250 is considered good.

2- Allowed Hits
Before displaying the allowed hits, I would like to present a comparison between his Hits vs Batted Ball Attempts for each pitch type to showcase the impressive extent of Verlander's dominance. First, let me show you a spray heatmap chart to see where the hits or batted ball attempts landed.
The majority of his hits were in the infield (reflected by the red color), primarily oriented between third base and second base. It's worth mentioning that the shortstop with the most appearances for Astros was Jeremy Peña.

Among both events, only 27.58% resulted in hits, while 72.42% were batted ball attempts. Also, the majority were ground balls at 37.7%, followed by fly balls at 27.63%.

Since his statistics show a very low opponent batting average (.186), an ERA of 1.75 (the lowest in 22 years), but with fewer strikeouts (186) compared to other pitchers who had more strikeouts, Verlander ranked 20th. Carlos Rodon ranked third with 237, Corbin Burnes second with 243, and Gerrit Cole claimed the first spot with 257 strikeouts.
Additionally, he ranked 15th for fewest hits allowed (116 hits in the regular season) and this can be translated into a WHIP (Walks + Hits per Innings Pitched) of 0.83, ranking him first in that category, in addition to having a BAPIP (Batting average on balls in play) of .240, placing him 6th. To conclude, he achieved an ISO (Isolated Power) of 0.84(Top 3). He is the most consistent player in MLB in terms of pitching quality.
It's worth mentioning that his average allowed hits measured by Launch Angle(°) was 16.9 degrees, ranking him 86th. Now, we'll focus on his allowed hits and take a look at a radial graph depicting the hits.
This graph is designed to display the allowed hits with their respective launch angle and exit velocity (mph), providing a reference, it's worth noting that the ideal range for hitting a home run falls between 25° and 35° launch angle. Considering this, it's noteworthy that he was the pitcher with the fewest allowed doubles and ranked within the top 20 for the fewest home runs allowed during the regular season.

3- Cy Young
Verlander won the award for the best pitcher in the American League. The other finalists were Alek Manoah of the Toronto Blue Jays and Dylan Cease of the Chicago White Sox. This accolade marked the third in the Astros pitcher's illustrious career.
Now, I want to show you some stats where Verlander ranks in the top 10, demonstrating why he was one of the two best in MLB (alongside Sandy Alcantara in the National League).
First, number 2 in most wins in the regular season and best ERA in the 2022 season.

Isolated Power (ISO) is a measure of a hitter’s raw power and tells you how often a player hits for extra bases, the MLB average ISO was 0.250 in 2022, which means Verlander was well below the average, allowing very few extra-base hits.


Comments
Post a Comment